Low abstraction level and tight relation between hardware and software makes
embedded development a lot more complicated than PC development.
Often new or inexperienced embedded developers are challenged by interrupt
handling – also known as interrupt service routines (ISRs) – the
process of servicing the hardware interrupt.
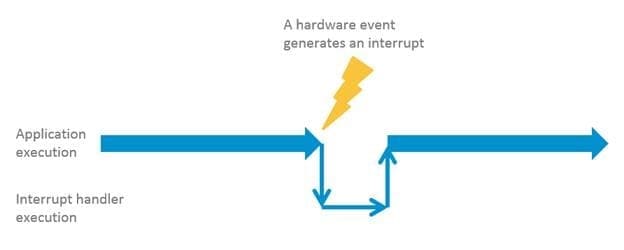
Interrupts and exceptions are events generated by the hardware. They can
interrupt the application software at any time, and the main software module
will not be aware it was interrupted. This causes a large number of problems
for embedded developers, who get a number of new complexities to understand
and .
Common causes for interrupts being triggered may be timers that expire,
communications interfaces that receive data bytes, DMA transfers being
completed, and so on.

Interrupts and exceptions are events generated by the hardware
By connecting a C function to an interrupt source, you can define what
software logic is to execute when the interrupt event fires. You need to write
an interrupt handler to respond to every type of hardware interrupt that is
enabled in the device. The interrupt handlers must then be inserted into the
proper place in the vector table so the hardware knows which interrupt handler
function to call when each interrupt fires.
If your application uses a real-time operating system (RTOS), interrupt
handling functionality is almost always part of the RTOS. This is for two main
reasons:
-
Interrupt processing is inextricably linked with prioritization and task
preemption
-
Exception handling is part of the value-add to the developer of using an
RTOS
If you are writing a bare metal application then you will need to become very
familiar with the interrupt mechanisms of the Arm Cortex-M architecture. In
the case of our Kinetis MCUs, you’ll find an abstraction layer that
bare metal applications can use to simplify interrupt handling.
Here are a few important concepts and facts you will want to remember when
working with Arm Cortex-M4 devices
- Exception handling in Kinetis MCUs based on Arm Cortex-M4 core
- IRQ interrupts are handled by ISRs
-
HardFault, MemManage fault, UsageFault and BusFault are fault exceptions
handled by the fault handlers
-
Arm Cortex-M4 devices use a nested vectored interrupt controller which
enables tail-chaining (back-to-back) interrupts for greater efficiency. No
overhead is needed to save and restore processor context during tail
chaining.
-
You configure the number of interrupts, and bits of interrupt priority. If
interrupts of higher priority occurs when a lower-priority interrupt handler
executes, it will be interrupted and nested interrupts can thus occur.
-
In your software setup you can choose only to enable a subset of the
configured number of interrupts, and can choose how many bits of the
configured priorities to use. If you are using Processor Expert, it manages
interrupt vectors and the vector table. If you want to define your own
interrupt(s) you must use Processor Expert to hook your interrupt handler
into the vector table
-
Kinetis devices (and all Arm Cortex-M core based microcontrollers) use a
reversed priority numbering scheme for interrupts. The highest priority
interrupt is given a 0 designation. It is important to know how many
priority levels are supported by the device you are using. Different Kinetis
devices have different numbers of levels. In Kinetis based on Arm Cortex-M4
core there are 16 levels of priority — the lowest priority is a 15.
Getting interrupts to work can be rather tricky, from getting a correctly
defined interrupt vector table linked on the right memory addresses, to
enabling interrupts properly and then processing them in an interrupt
handler. It all involves advanced topics like linker configuration files, SFR
register bit field configuration and manipulation, interrupt #pragmas,
possibly inline assembly and more.
Debugging interrupts and exceptions
So how do you go about analyzing and debugging the behavior of your interrupts
and exceptions on an Arm Cortex-M device like Kinetis? Interrupts and
exceptions are by definition asynchronous to the execution flow of your
application software and it can be very difficult to visualize interrupt
behavior, and debug the same. Fortunately, the Arm Cortex-M core has brilliant
hardware support for visualizing and debugging interrupt behavior. This is how
to use it.
To analyze exception and interrupt behavior, the debugger must use the SWD
debug mode and have SWV enabled. Furthermore, the debugger must be configured
to enable event tracing for interrupts and exceptions. If you want to use
real-time graphical chart plots as well for system analysis visualization, SWV
timestamps must be enabled too.

Configure the debugger to enable event tracing for interrupts and exceptions
With that basic configuration out of the way, the debugger can be used for
real-time system analysis, for example listing all interrupt and exception
events that occur as the application is executing at full speed, including
exception entry, exception return and exception exit. This enables
developers to work out if an interrupt actually fires, how often, and which
interrupts intermix over time. It also enables developers to work out any
interrupt nesting situations, as well as timing matters. With more capable
debuggers like Atollic TrueSTUDIO you can also see what peripheral module
generated the interrupt, and what interrupt handler is connected to the
interrupt. A double click on the interrupt handler automatically brings you to
the right code line in the source code editor as well.

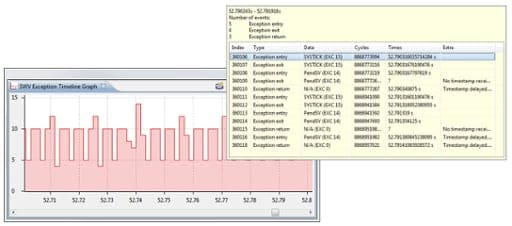
Debugger provides real-time system analysis, including exception entry,
return and exit
A graphical chart plot of the interrupt behavior provides an
easy-to-understand view of how many interrupts fire over time. This is
particularly useful if interrupts are expected to fire in certain patterns.
Good debuggers also provide you with interrupt statistics information for each
interrupt type; listing interesting information such as:
- What interrupt handler function is connected to the interrupt?
- What % of all fired interrupts is this one?
- Number of times this interrupt has fired?
- What % of interrupt handling time was spent handling this interrupt?
- Total time of all occurrences of this interrupt?
- Average time of all occurrences of this interrupt?
- Fastest and slowest time of handling this interrupt?
- When was the first time this interrupt fired?
- Etc.
A good debugger, like
Atollic TrueSTUDIO, also allows you to double click on any interrupt and jump directly to the
source code lines.
Summary: Arm Cortex-M core based devices, like Kinetis MCUs, offer many
compelling capabilities for embedded developers
Because it’s a modern 32-bit processor architecture, many developers
are not fully aware of its capabilities and the complexities they bring.
A key to successful Kinetis development is to understand interrupt handling,
and in particular debugging of interrupts and exceptions. A powerful debugger
brings capabilities for interrupt and exception tracing, graphical
visualization, as well as interrupt timing and statistics and capabilities for
runtime error detection using a hard fault crash analyzer.


