In my
August post
‘A look at die-level heat transfer’, I introduced the idea of a
MOSFET ‘detailed model’ which could be used for predicting
temperature rise and heat flow in the die at very short times scales. This was
followed by my
September post
‘Top Clip’ where I took the idea of a detailed die model
further, showing how a top clip could be added to a standard D2PAK device in
order to improve the thermal performance of the device over a specific time
range. This D2PAK case was a purely hypothetical example. So in this post I
would like to look at some real devices that use a package which
does have a top clip, NXP’s
LFPAK56 and see how the thermal performance would be affected if the top clip was
not present.
Before I come to that, I’d first like to introduce the concept of
‘transient thermal impedance’. Transient thermal impedance
graphs, also known as ‘Zth curves’ (zed-theta
curves), are a convenient way of describing time-dependent thermal behaviour
without referring to specific power levels or temperature rises. If
you’re not already familiar with Zth curves then I urge you
to take a look at our
Application note – Using Power MOSFET Zth Curves, and in particular the worked example in Section 2.1. I’ll wait a
minute for you to do that… OK, so now we’re all comfortable with
the idea of Zth curves, let’s return to the LFPAK56.
If you look at our focused package page on NXP.com,
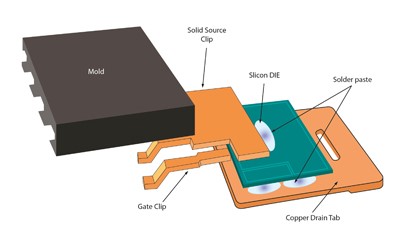
LFPAK56 – The toughest power-SO8, in the section ‘Innovative clip-bonding’ you’ll see an
exploded view of the package, which is also shown below. In this case the top
clip is labeled ‘Solid Source Clip’.

Figure 1: An exploded view of an LFPAK56 package.
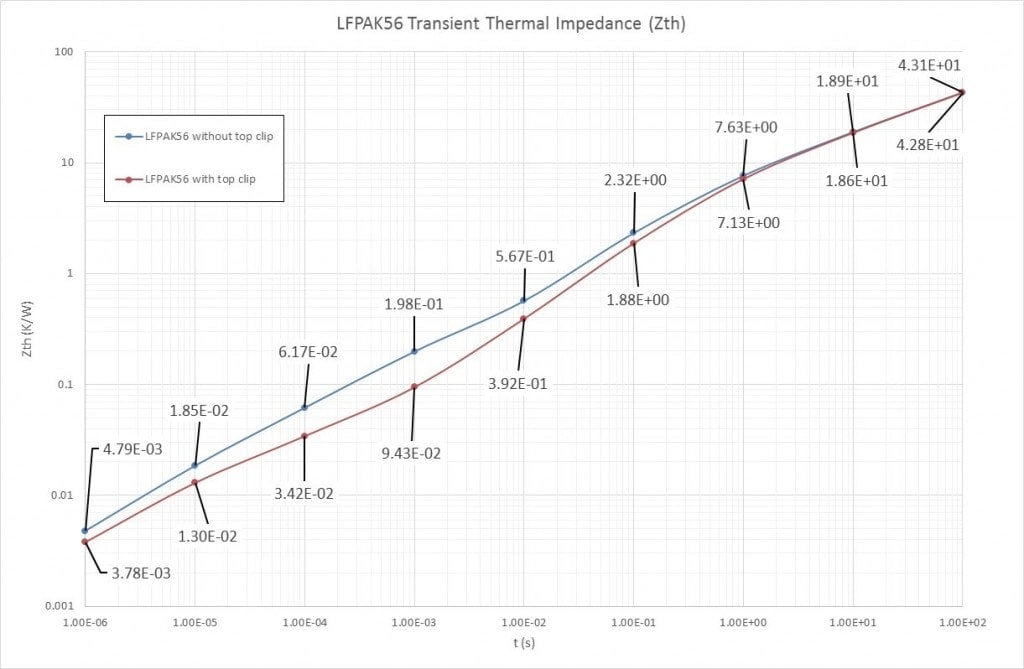
Using the detailed model approach for the die we can produce Zth
curves for an example LFPAK56 device, both with and without the top clip. The
device was modelled on a single-sided FR4 PCB with 1” square of top
copper in the
JEDEC
JESD51-2A test enclosure. The results are shown in Figure 2, and given that
reading numbers from log-log graphs can sometimes be tricky, I’ve
labeled the data points to make things clearer.

Figure 2: Example Zth curve for an LFPAK56 with and without top clip.
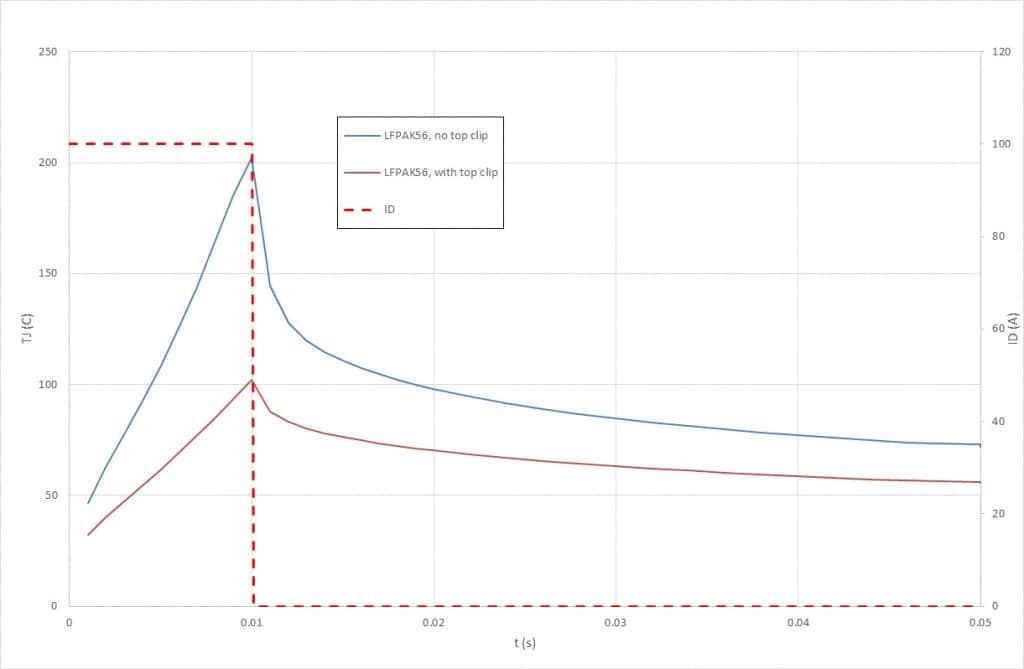
To further illustrate the point I ran two further simulations – again
for the LFPAK56 with and without top clip. This time for the device conducting
a rectangular 100 A, 10 ms current pulse. The results are shown in Figure 3.

Figure 3: TJ for an LFPAK56 with and without top clip when subjected to a
100A, 10ms pulse.
Clearly the top clip is making a big difference. At shorter time scales the
Zth figure is more than halved at 1 ms (Figure 2) and peak
temperature significantly reduced for a 10 ms current pulse (Figure 3).
However looking again at the Zth curves for longer time intervals,
the top clip appears to have less and less effect. In fact once we’re
into the seconds range it has almost no effect at all. This is one of those
‘non-intuitive’ results I mentioned in my
first post: “if I stick a heatsink (i.e. the top clip) on top of something hot then
shouldn’t it always make it cooler?” As is so often the case, the answer to this question is clearly
‘it depends’ – more on this in the near future.
In my next post I will begin an exploration into the interesting and sometimes
controversial topic of ‘top-side cooling’.


